Statistics
The RimuSDR Connection Statistics dialog reports what the link between RimuSDR and the radio is carrying, how well the network is delivering it, and whether this computer is keeping up. Use it when audio drops out, when the display stutters, or when you want to know what a connection costs in bandwidth.
There are two ways to open it:
- Settings › Connection Statistics... opens the dialog on the tab you last used.
- A click on the network icon in the status bar opens it on the Network tab.
The figures are live and update every second while the dialog is open. The dialog can be resized, and RimuSDR remembers its size and position.
Connection Health
Two verdicts sit above the tabs. They answer two different questions, and each can be good while the other is bad.
- Network
- Is the network delivering packets? This is the radio library's own grade of the link, from round-trip time and lost packets: EXCELLENT, VERY GOOD, GOOD, FAIR, or POOR. It is quick to fall and slow to recover, so it reflects the worst recent behavior rather than the current reading. For the thresholds, see How the Network verdict is graded.
- This Computer
-
Is this machine keeping up with the packets that did arrive? It is graded from the This Computer group on the Errors tab:
Verdict Meaning What to do OK No packets are being discarded, and malformed packets are under 0.1% of everything received. Nothing. BEHIND RimuSDR is discarding packets because its own processing queues are full. The computer is too busy. Close other demanding applications, reduce the number of panadapters, or lower the waterfall rate. ERRORS Packets are arriving that RimuSDR cannot read. This is unusual. Note the figures on the Errors tab and contact support. BEHIND and ERRORS describe what is happening now: the verdict returns to OK once the count stops climbing. The counts themselves stay on the Errors tab.
Read the two together. Network at POOR with This Computer at OK means the problem is on the network. Network at EXCELLENT with This Computer at BEHIND means the network is fine and the computer is the bottleneck.
Network
Latency to the radio, the audio data rates, and a graph of latency over time.
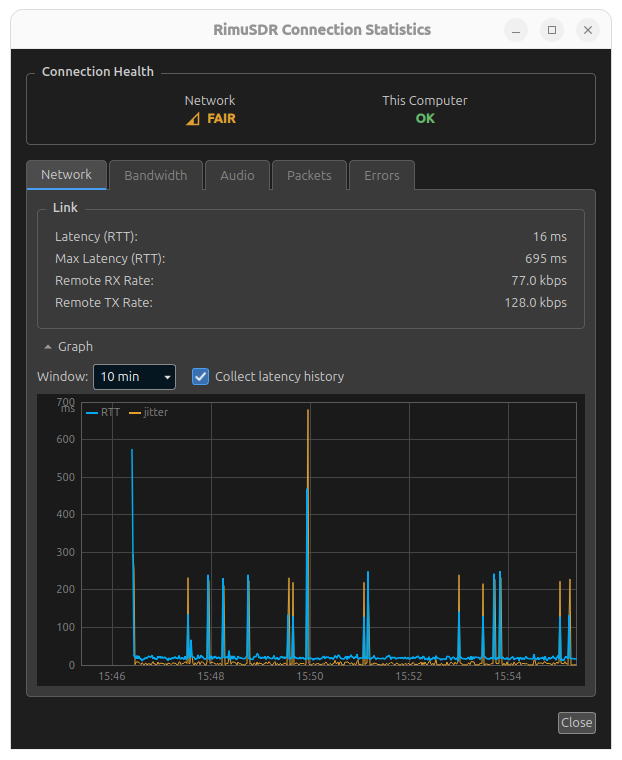
What the screenshot shows:
- The baseline is good. Between spikes, the blue round-trip trace stays close to the 16 ms current reading.
- The spikes come at irregular intervals. They often arrive in pairs a few seconds apart, and there is a quiet stretch of almost two minutes after 15:51.
- Most spikes reach about 250 ms. On some, the blue line stops near 130 ms. The graph plots the average of the readings in each pixel column, so one high reading next to a normal one is drawn at about half its height. The orange jitter trace still shows the full jump.
- One spike is larger. At about 15:50 the jitter trace jumps about 680 ms. That matches a reading of 695 ms, the figure shown as Max Latency.
- Jitter rises with each spike. Each change in latency is sudden rather than gradual.
- The spikes are not caused by transmitting. No red transmit shading appears behind the trace.
- Network reads FAIR although the current latency is 16 ms. The last spike is only seconds before the capture, and the grade is slow to recover.
- This Computer reads OK. The computer is keeping up with the data that arrives, so the trouble is on the network.
- Latency (RTT)
- The current round-trip time to the radio, in milliseconds.
- Max Latency (RTT)
- The worst round-trip time since the statistics were last reset.
- Remote RX Rate and Remote TX Rate
- The audio data rate in each direction, in kilobits per second.
- Graph
- Click to show or hide the latency graph. Window sets how much history the graph shows, from 10 minutes to 24 hours. The graph stays empty until you tick Collect latency history.
What the tab measures
The readings come from two different sources, carried over two different transports.
Latency and jitter: TCP
RimuSDR sends a ping command to the radio once per second over the command
channel, and times how long the reply takes. This is an application-level
round trip, not an ICMP ping, so it includes the time the radio takes to handle
the command.
Latency (RTT), Max Latency (RTT), and both series on the graph come from this ping.
| Connection | Transport | Port |
|---|---|---|
| Local network | TCP | 4992 on the radio |
| SmartLink | TLS over TCP | The radio's public TLS port, as advertised by SmartLink, or a negotiated port when hole punching is needed |
Network loss and audio rates: UDP
The radio sends its data streams as VITA-49 packets over UDP. The Network loss table on the Errors tab counts what each of those streams lost. Remote RX Rate and Remote TX Rate measure the audio streams.
| Connection | Transport | Port |
|---|---|---|
| Local network | UDP | 4991 by default, the port RimuSDR receives on |
| SmartLink | UDP | The radio's public UDP port, as advertised by SmartLink, or the hole-punched port |
Why the difference matters
TCP does not lose packets silently. When a TCP packet is lost, it is retransmitted, and the loss appears as a delay instead. On Linux, TCP waits at least 200 ms before it retransmits, so one lost packet on the command channel shows as a latency spike of roughly 200 ms above the baseline.
A latency spike can therefore mean a lost packet as well as a slow one. The Network loss table counts the UDP data streams only, so it does not show loss on the TCP command channel.
The Network verdict uses both sources: the TCP round-trip time, and the loss counted on the UDP receive audio, panadapter, waterfall and meter streams.
How the Network verdict is graded
The verdict is re-evaluated every second, from the round-trip time and from packet loss. It is deliberately quick to fall and slow to recover.
It falls immediately. A single round-trip at or above the poor threshold drops the verdict straight to POOR, whatever it was before.
It recovers one grade at a time. Each step up needs six consecutive seconds of clean readings, so climbing from POOR back to EXCELLENT takes about 24 seconds of good behavior.
It starts at EXCELLENT. A new connection is graded from the top and can only fall from there, so a healthy link reads EXCELLENT within a second or two of connecting. With no radio connected, the verdict reads Disconnected.
The thresholds depend on how you are connected:
| Connection | Fair from | Poor from |
|---|---|---|
| Local network | 50 ms | 100 ms |
| SmartLink | 100 ms | 500 ms |
Packet loss also counts against the grade. On a local network any new lost packet does. Over SmartLink, loss has to exceed a few percent.
The grade counts loss across receive audio, the panadapter, the waterfall and the meters. The Network loss table on the Errors tab shows the same loss per stream.
Because one bad reading pulls the grade down and recovery is slow, a link can read badly while its current latency looks excellent. The grade reflects the worst recent behavior, not the average.
The graph
Click Graph to show or hide the latency graph below the readings.
The graph plots two series:
- RTT
- Round-trip time, in blue.
- jitter
- How much the round-trip time varies from one reading to the next, in orange.
Each pixel column of the graph covers several readings and plots their average. A single high reading beside normal ones is therefore drawn lower than its true value; the jitter series shows the size of the jump.
Periods when you were transmitting are shaded in red behind the trace, so you can tell a latency spike caused by transmitting from one caused by the network.
Collecting history
History collection is off until you turn it on
RimuSDR does not record latency history unless you ask it to. With collection off, the graph is empty and says so. Tick Collect latency history to start.
Once collection is on, history keeps accumulating even while the graph is hidden or the dialog is closed. Unticking the box stops collection but keeps what was already recorded.
Choosing a time window
Window sets how much history the graph shows: 10 min, 30 min, 1 hour, 3 hours, 6 hours, 12 hours, or 24 hours. RimuSDR remembers your choice.
A short window shows individual spikes. A long window shows whether a problem is steady, or tied to a time of day - another user on the network, a scheduled backup, or a VPN renegotiating.
What to do about latency
- Regular spikes on a local network
- Something on the network is periodically busy. WiFi is the usual cause; try a wired connection. Otherwise look for a device or scheduled task that runs on that interval.
- Steadily high latency over SmartLink or a VPN
- Raise the RX buffer in Radio Setup - Audio Settings so that audio rides out the delay.
- Loss on the Network loss table
- The network is losing data, which RimuSDR cannot recover. On WiFi, try a wired connection.
Bandwidth
What the connection is carrying now, in kilobits per second, split by direction.
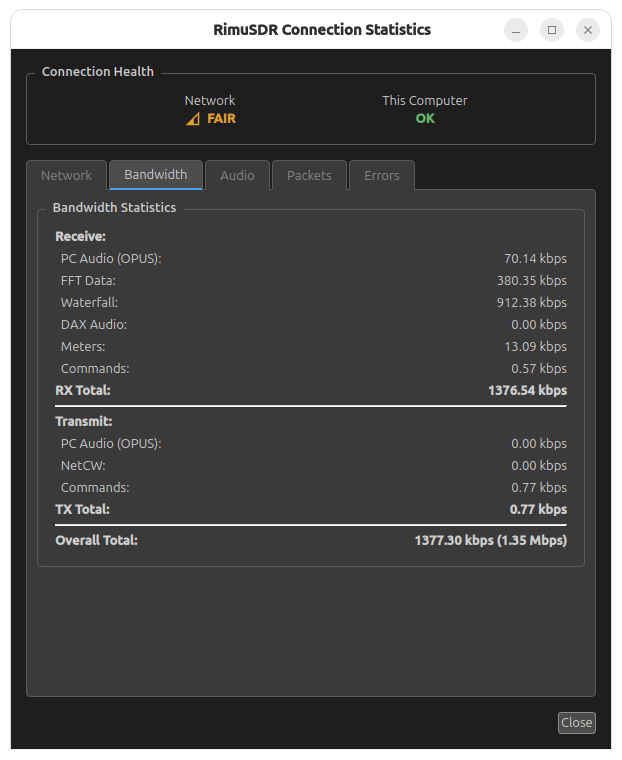
The receive side breaks down into:
- PC Audio
- Receive audio for your speakers, with the codec in use shown in brackets.
- FFT Data and Waterfall
- The panadapter and waterfall displays. Together these are usually the largest consumer.
- DAX Audio
- DAX audio is carried on RimuDAX's own connection to the radio, not on this one, so this row stays at zero. RimuDAX reports its own statistics.
- Meters
- S-meter, power, SWR and temperature readings.
- Commands
- Radio control traffic. Always small.
The transmit side carries PC audio, NetCW for CW keying, and commands.
Overall Total is the figure to quote when sizing a connection. A busy local link runs at a few megabits per second, most of it panadapter and waterfall data. Reducing the number of panadapters, or lowering the waterfall rate, is what brings it down.
Audio
Receive audio latency and health. This is the tab to open when audio is breaking up.
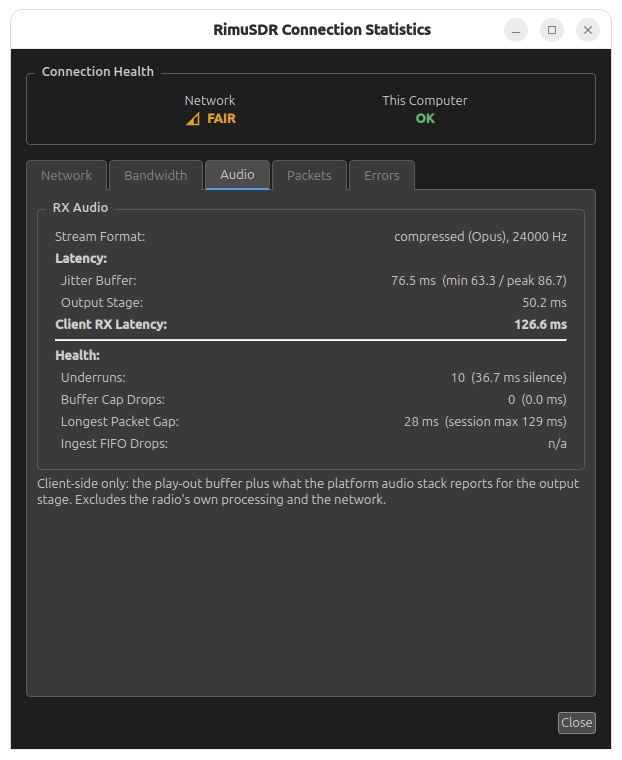
- Stream Format
- The codec and sample rate in use, set by RX stream in Radio Setup - Audio Settings. Over SmartLink, RimuSDR always uses the compressed Opus stream.
Latency
- Jitter Buffer
- The play-out buffer, set by RX buffer in Radio Setup.
- Output Stage
- What the platform audio stack reports for its own output path.
- Client RX Latency
- The two added together. This is delay added by this computer.
This is client-side only
The figure covers the play-out buffer and the platform output stage. It excludes the radio's own processing and the network, so it is not the total delay between a signal arriving at the antenna and reaching your ears.
Health
- Underruns
- Times the audio path ran out of data, with the total silence that caused. Anything above zero is audible.
- Buffer Cap Drops
- Audio discarded because the buffer was full.
- Longest Packet Gap
- The largest gap between two received audio packets, with the worst seen this session in brackets.
- Ingest FIFO Drops
- Audio discarded before it reached the buffer. Only counted on an uncompressed stream; reads n/a on Opus.
Longest Packet Gap is the number that explains a dropout. If the session maximum exceeds your RX buffer setting, the buffer ran dry and you heard it. Raise the RX buffer above that figure in Radio Setup - Audio Settings and the same gap is ridden out silently.
Packets
Cumulative counts and rates since the connection started, or since the statistics were last reset.
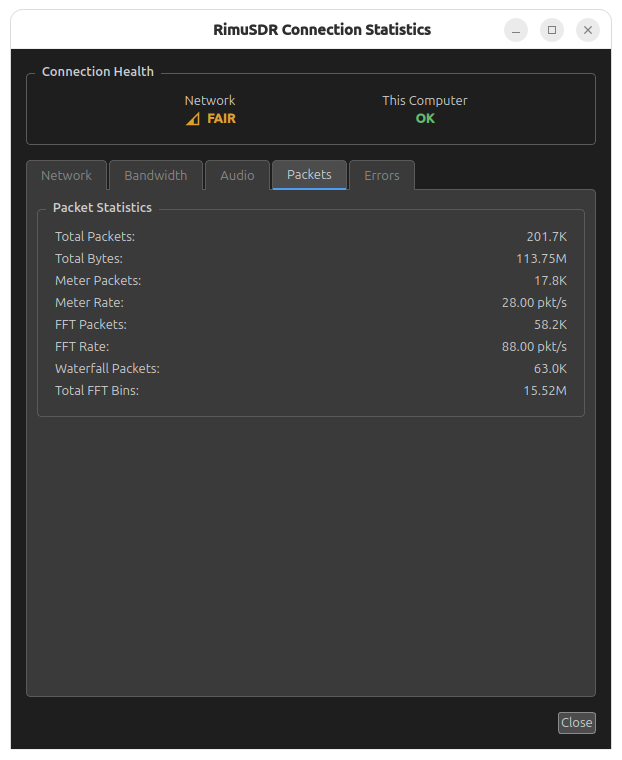
Total Packets and Total Bytes cover everything. The rest breaks out the meter, FFT and waterfall streams, with the packets-per-second rate for the two that run continuously.
These are diagnostic figures rather than something to act on. They are most useful when reporting a problem, because they show how long a connection has been up and how hard it has been working.
Errors
Two groups, because they answer different questions. Network loss is what never arrived. This Computer is what arrived and was then mishandled here.
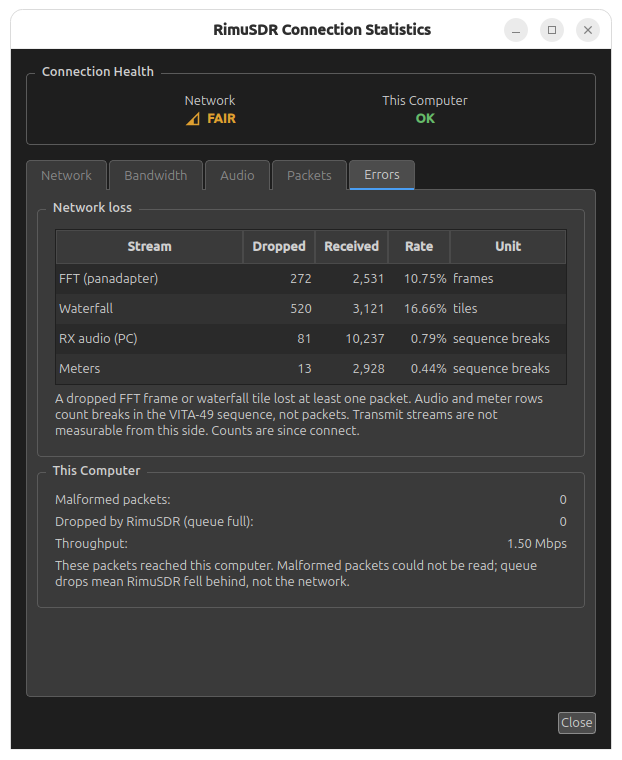
What the screenshot shows:
- The network is losing packets. Every stream has lost something: 0.79% of the audio sequence and 0.44% of the meter sequence are broken, and 10.75% of panadapter frames and 16.66% of waterfall tiles never completed.
- The frame and tile rates are higher because each one is made of several packets. A frame is lost if any one of its packets is, so a small per-packet loss shows as a much larger per-frame loss. The audio and meter rows are the closer measure of the loss itself.
- This Computer is not the cause. Malformed packets and queue drops are both zero, so everything that arrived was handled. This is the same SmartLink connection as the Network screenshot, and its verdict is FAIR.
Network loss
One row per stream, counted since the connection started:
- Stream
- Which data stream the row covers. FFT (panadapter) and Waterfall are the displays. RX audio (PC) is the audio for your speakers. Meters is the S-meter, power and SWR readings. A DAX row appears only for a DAX stream that RimuSDR itself owns; RimuDAX's streams are on its own connection and are not measured here.
- Dropped and Received
- What was lost and what arrived. A stream that is not running reads a dash and not active.
- Rate
- Dropped as a percentage of Received.
- Unit
- What the row counts. A dropped frame or tile lost at least one of its packets. Audio and meters count sequence breaks: each packet carries a 4-bit counter, and a break is any jump in it. A burst of lost packets is one break, so the count is lower than the number of packets lost.
Transmit streams are not measured
The radio reports nothing about the audio and CW it receives from RimuSDR, so loss on the transmit side cannot be measured from this end.
This Computer
- Malformed packets
- Packets that arrived but could not be read, because they were too short or damaged. This is rare, and should stay at zero. A climbing count sets the This Computer verdict to ERRORS.
- Dropped by RimuSDR (queue full)
- Packets RimuSDR discarded itself, because its own meter or panadapter processing queue was full. The computer was not keeping up with the data; the network lost nothing. A climbing count sets the verdict to BEHIND.
- Throughput
- Overall data rate, in megabits per second.
Resetting the statistics
Right-click anywhere in the dialog and choose Reset Statistics. This clears Max Latency, discards the recorded latency history, and resets the counts on the Packets tab and in the This Computer group.
The Network loss table is not cleared. Its counts run from the moment the connection started.
Reporting a problem
If you contact support about audio or connection trouble, the useful figures are:
- The two Connection Health verdicts.
- Max Latency, from the Network tab.
- The Rate column of the Network loss table, from the Errors tab.
- Malformed packets and Dropped by RimuSDR, from the Errors tab.
- Longest Packet Gap and its session maximum, and Underruns, from the Audio tab.
- Overall Total bandwidth, from the Bandwidth tab.
Together these separate a network problem from a computer that is falling behind, and from an audio configuration problem. See contact support.